Back to portfolio
Timeline Planner logo

AI Lab · Case study

Timeline Planner

From whiteboard to reality — turn raw brainstorms into a structured, dependency-aware delivery roadmap.

Year

2026

Status

Completed

Platform

Web app

Stack

Base44 · AI vision

Open live app

01 / What it does

Timeline Planner turns raw whiteboard brainstorms — photos of sticky notes, planning boards, or just a text prompt — into a structured, visual project roadmap with actionable features, delivery dates, and team assignments. You upload the photo, the app uses AI vision to extract every task, theme, and estimate, and then runs a scheduling algorithm to produce a Gantt-style timeline across your available teams.

Planning sessions generate messy, unstructured output. This app automates the entire pipeline: capture → extract → prioritize → schedule → visualize → report.

02 / The product

Capture, schedule, analyze — one continuous flow.

Dashboard
Project timeline Gantt
AI risk analysis

03 / Core features

End-to-end product thinking, automated.

Three ways to capture a backlog

  • Whiteboard image upload — AI vision reads sticky notes, detects color-coded swimlanes (a differently-colored leftmost note = the theme label for that row), infers priority from spatial position, and converts time estimates ("2w", "5d") into weeks
  • AI text generation — describe a project in plain text and the LLM proposes a feature breakdown with themes, effort estimates, and dependencies
  • Manual entry — type features directly

Dependency-aware scheduling engine

  • A custom scheduling algorithm sorts features by priority and resolves dependencies iteratively — a feature can't start until its dependencies finish
  • Assigns each feature to the team/stream that becomes available earliest, respecting required-team constraints
  • Accounts for team capacity, parallel streams (a team working on multiple features at once), and unavailability periods (holidays, conferences) by stretching durations and shifting start dates accordingly

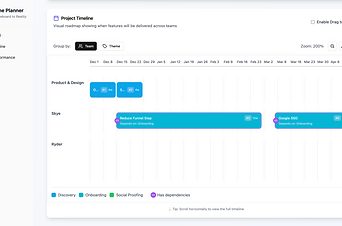
Interactive Gantt chart

  • A zoomable, groupable timeline (group by team or by theme)
  • Drag-and-drop reordering, dependency lines, and hover tooltips showing full feature details

Team & capacity modeling

  • Supports generic teams (count + weekly capacity) or rich custom team groups
  • Members, roles, capacity multipliers, skills, parallel streams, unavailability windows, and utilization forecasts

Scenario planning

  • Create multiple "what-if" scenarios (e.g., "3-team sprint" vs. "reduced capacity") with their own team groups
  • Generate independent schedules per scenario and compare them side-by-side
  • An AI scenario generator can propose scenarios from your feature set

AI-powered analysis

  • Optimization suggestions — recommends reassigning or splitting features to shorten delivery
  • Capacity forecast — projects team utilization over time
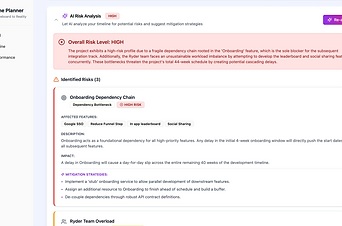
  • Risk analysis — flags dependency bottlenecks and over-loaded teams
  • What-If analyzer — simulate adding/removing teams or capacity and see the projected finish date

Leadership reporting

  • A dedicated report view categorizes features into in-progress / upcoming / completed
  • Update per-feature status and notes, and generate AI executive summaries and risk assessments
  • Export as Markdown, copy summary, or capture the dashboard as a JPEG

Collaboration & sharing

  • Timeline owners can invite collaborators by email with view-only or edit access
  • Permissions are enforced per timeline, and shared timelines appear on the recipient's dashboard

Export & dashboard

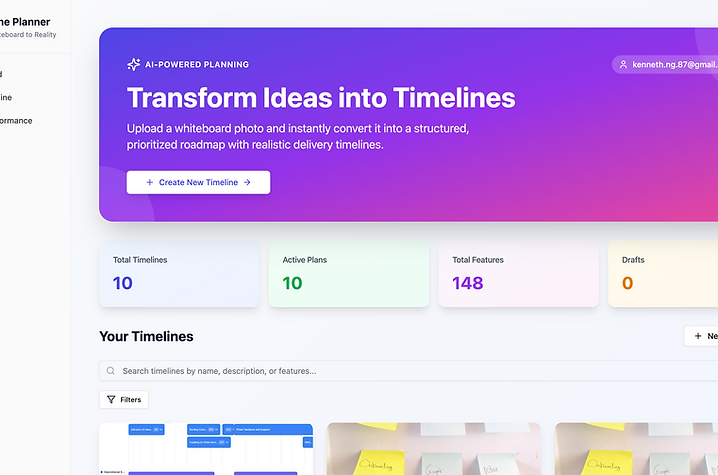
  • Dashboard with search/filter by status, ownership, and date
  • Summary stats and one-click export to CSV, PDF (print), or JPG

Tech stack

  • Frontend: React + Tailwind CSS + shadcn/ui, React Router, TanStack React Query, Recharts, Framer Motion
  • Backend: Base44 BaaS — entities (Timeline, Feature, Team, TeamGroup, Scenario, ScenarioSchedule, TimelineAccess), built-in auth, and the Core integration
  • AI: LLM vision for whiteboard extraction and AI-text generation; LLM text for optimization, risk, and executive-report generation

Try the app, or start a conversation.